The logbook feature is one of the most useful for recording events onto your data. You can see place markers where you have logged entries so that you can review those remarks later in time. You can also review a list of all your remarks.
There are currently two ways to add logbook entries.
Logbook entry method 1 (directly on the graph)
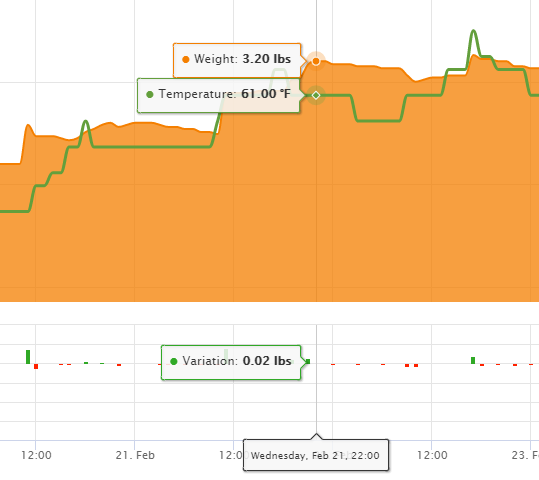
Select the date & time slot you would like to add the logbook entry using the cursor. In the case below, the selected time is Wed, Feb 21 at 22:00 (10pm). Make sure that the cursor is on the weight or temperature line graph.
2.) Left click on your mouse and the Logbook entry window appears.

3.) Enter text under Event Details. Click on Save when you are done. You will notice a small flag on the location on the graph where the logbook entry is located.
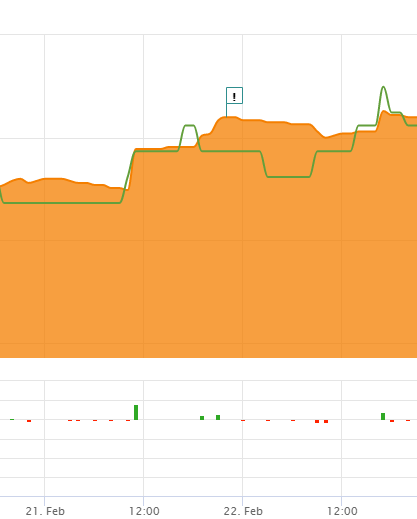
4.) Mouse over the flag in order to see the logbook entry.

Logbook entry method 2 (type logbook entry in Table view)
Go to the Tabular View of the data.
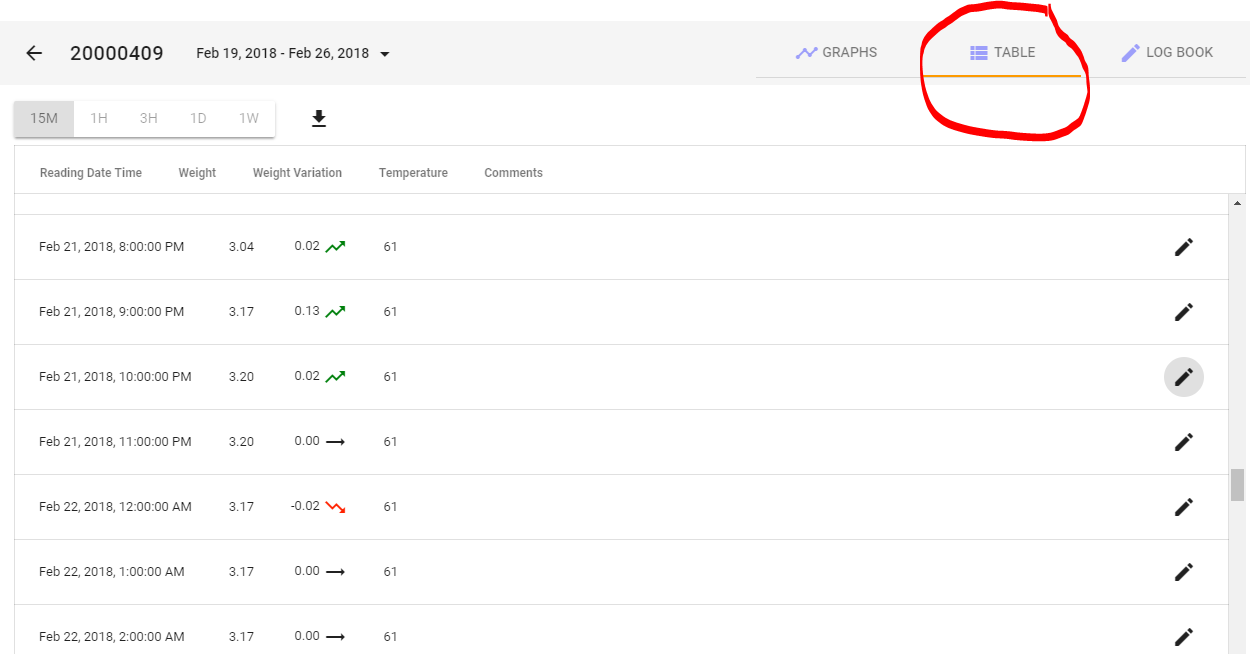
2.) Click on the pencil icon corresponding to the time interval you would like to enter the logbook entry into. The logbook window appears.
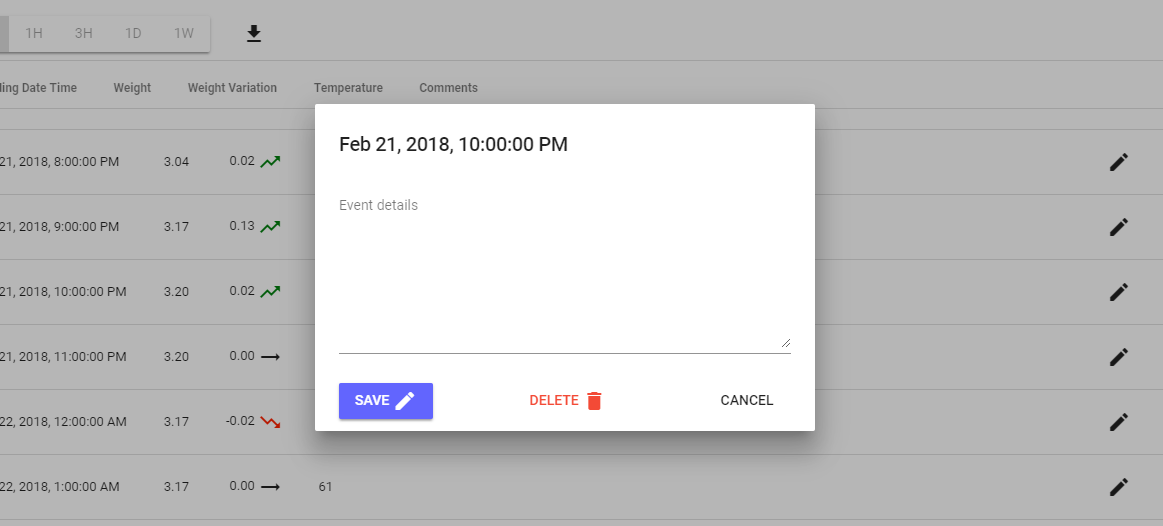
3.) Type in the logbook entry and press Save. The entry is visible in the Comments column. It will also be visible on the graph with the “!” flag.

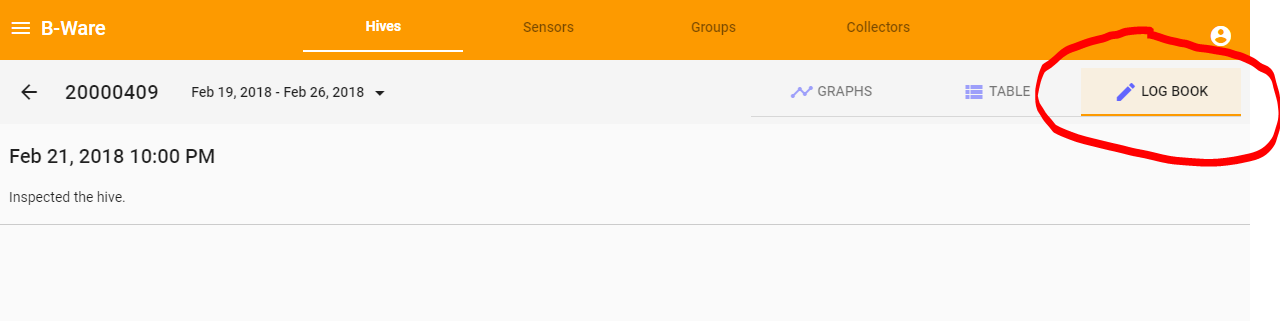
Logbook View
You can see all your logbook entries by clicking on the “Logbook” heading on the web app.